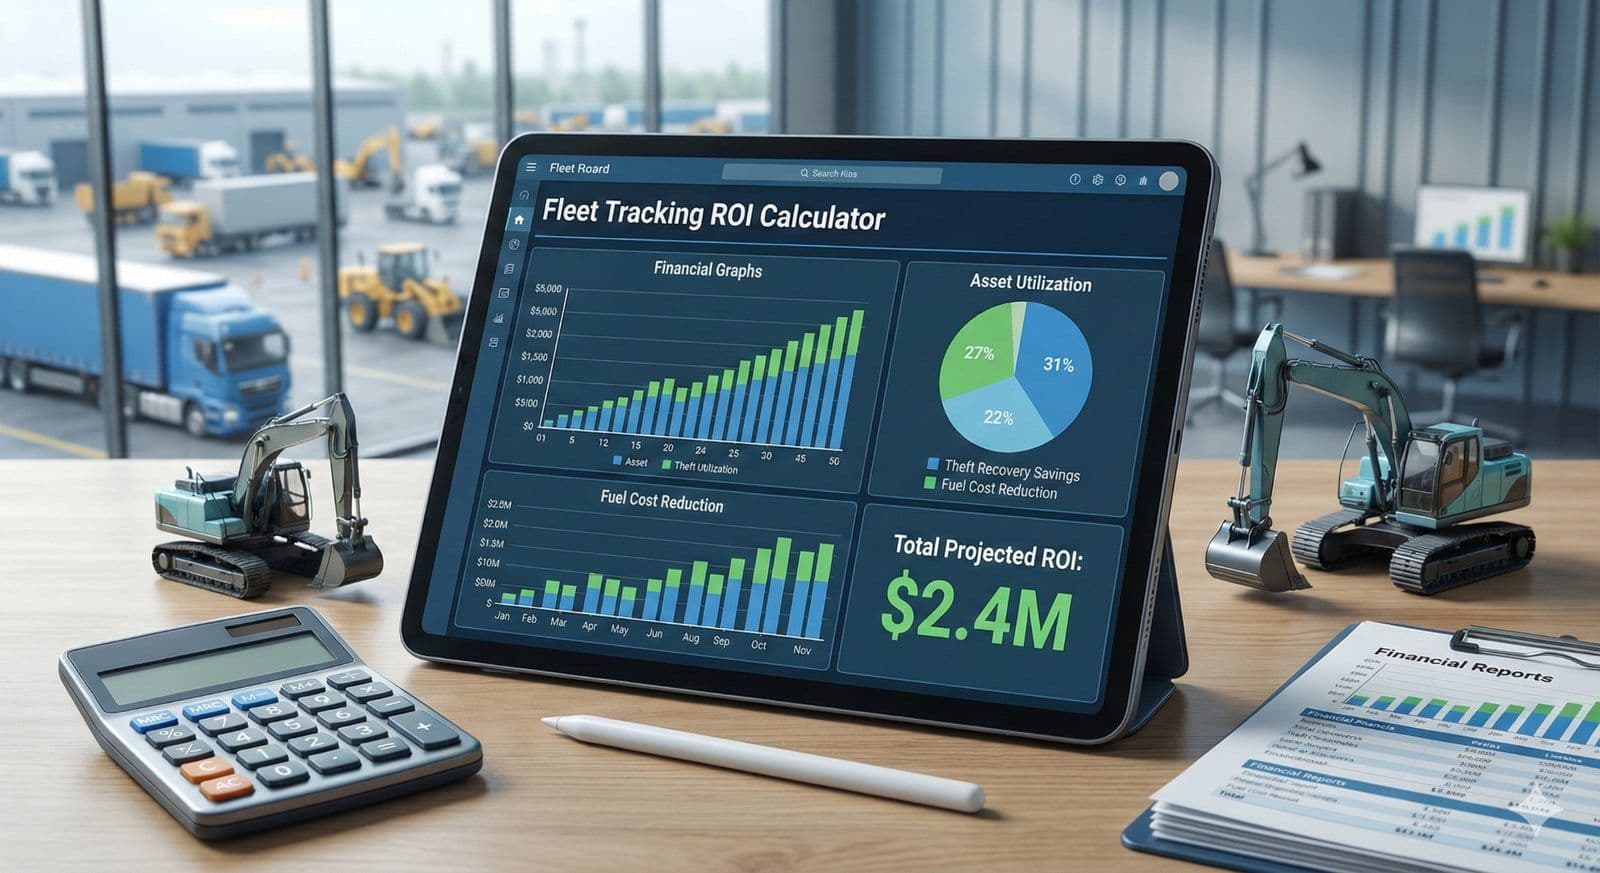
A fleet tracking ROI calculator is a business-case framework that turns "we should track our equipment" into a number a CFO will sign off on. For an equipment rental operation, the return comes from a handful of concrete levers — recovered billing hours, redeployed idle assets, theft recovery, and lower maintenance and admin waste — measured against the per-asset cost of tracking. This guide breaks down each lever, gives you the formulas, and shows you how the pricing model itself changes the math.
Every number below is either sourced, labeled as a worked example, or something you should confirm for your own operation. The point of a ROI model isn't optimistic round numbers — it's a defensible case built on your actual data.
KEY TAKEAWAYS
- A rental-fleet ROI case is built from four measurable levers: recovered billing, asset utilization (idle and "ghost" assets), theft recovery, and maintenance/admin efficiency.
- Billing is usually the fastest payback: recovering even 2 unbilled runtime hours per week across 50 machines at $100/hour is roughly $10,000/week — a worked example, not a promise; plug in your own rates.
- Construction equipment theft exceeds $1 billion a year in the U.S. (National Equipment Register), and recovery rates are low without telematics — so recovery value belongs in the model.
- Hapn prices per asset — $10/mo (asset & vehicle), $13/mo (equipment with utilization), $18/mo (equipment telematics with engine data) — so the cost side of your ROI scales with tracked assets, not with yards.
- The pricing model matters as much as the rate: choose a 3-year plan with all hardware included at no upfront cost, or a 1-year agreement with hardware purchased at cost. Assets you add later are prorated onto the same end date.
WHAT IS A FLEET TRACKING ROI CALCULATOR?
A fleet tracking ROI calculator is a financial model that projects the return on GPS and telematics by summing measurable annual savings — recovered billing, redeployed assets, theft recovery, insurance considerations, and maintenance efficiency — and dividing by the annual cost of hardware and subscription. It converts operational benefits into the P&L language a CFO evaluates: hard-dollar savings, risk reduction, and capital efficiency.
Building your business case?
Start from a model with the formulas already built for utilization, theft, and maintenance savings — then drop in your own numbers.
Get the ROI template (Google Sheets) →When you walk into a CFO's office to request budget, "peace of mind" isn't a line item. For a rental operator, dealer network, or equipment financier, the case has to be made in dollars: what does not tracking the fleet cost, and does the investment beat it? Here are the five inputs that make that case.
1. Recovered Billing: The Fastest Payback
For rental companies, billing accuracy is often the difference between a thin month and a profitable one. If a customer rents a boom lift for a "single shift" (8 hours) but runs it for 14, you're depreciating the asset faster than you're being paid for it. Telematics gives you runtime and engine-hour data as irrefutable proof of usage, which you can feed into automated overtime and usage-based billing.
Worked example (plug in your own numbers): recover just 2 hours of unbilled runtime per week across 50 machines at $100/hour, and that's $10,000/week in recovered revenue. The inputs that matter are your machine count, your hourly rate, and how much runtime currently goes unbilled — the asset and equipment tracking data closes that gap.
2. Utilization & Ghost Assets
Capital efficiency is where rental and dealer fleets leak the most. Assets get deployed and sit idle, or become "ghost assets" hoarded at a remote yard "just in case" — while the branch cross-rents the same class of machine at full cost. Our fleet utilization benchmarks walk through how operators quantify that idle time; utilization gains in the mid-teens percent are commonly cited, but the honest input for your model is your own current utilization rate versus where visibility could push it.
Illustrative case: a 200-asset rental operator whose utilization reports reveal idle owned excavators while the yard sub-rents the same class can redeploy instead of cross-renting. Even eliminating a few thousand dollars of monthly sub-rental spend is often the single fastest line in the model to pay back the subscription. Operators running a distributed, financed base — like C3 Rentals — lean on this visibility to keep owned iron working before reaching for a sub-rental.
| Scenario | Without Telematics | With Hapn Utilization Data |
|---|---|---|
| Asset visibility | Field reports, often inaccurate | Real-time location and runtime status |
| Capital decisions | Buy new when inventory "feels tight" | Redeploy idle assets before buying |
| Sub-rental spend | High, driven by blind spots | Reduced by maximizing owned fleet |
See every asset on one map
From heavy iron to battery-powered trailers, track your whole rental fleet on one platform — priced per asset, not per yard.
Get Hapn pricing →3. Theft Prevention & Recovery
Asset protection is the most tangible ROI line, and it's real money: the National Equipment Register estimates construction equipment theft exceeds $1 billion annually in the U.S., and recovery rates are low without telematics. Insurance may eventually cover replacement, but it doesn't cover project delays, deductibles, higher renewal premiums, or the administrative drag of a claim — which is why theft belongs in the model as more than just the machine's sticker value. Our breakdown of construction equipment theft covers how GPS shifts recovery odds.
A SIMPLE THEFT-ROI FORMULA
Projected annual theft savings = (A × B) − C, where A = your average annual value of stolen/unrecovered assets (equipment value + deductibles), B = an indirect-cost multiplier for downtime and rush replacements (many operators use ~1.5), and C = the annual subscription cost. Use your own three-year loss history for A — not an industry average.
4. Insurance: A Bonus, Not a Guarantee
Some insurers offer premium considerations for fleets running verified GPS tracking and recovery, and a documented telematics program can help at renewal — but this varies widely by carrier, policy, and how much data you're willing to share, and it is not a guaranteed line item. Treat it as a question for your broker, not a number you bank the business case on: ask specifically about telematics or recovery-device credits at your next renewal, and if your carrier offers one, add it to the model as upside. Build the ROI case so it stands on billing, utilization, and theft alone; any insurance credit is then a bonus rather than a dependency.
5. Maintenance & Admin Efficiency
The last pillar moves you from reactive repairs to planned uptime. Without engine-hour data, maintenance is a guess — you might service a loader every three months whether it ran 500 hours or 50. Over-servicing wastes labor and parts; under-servicing invites catastrophic failure. Runtime-based scheduling puts service on actual usage.
Admin waste is the quiet cost. Mixed fleets often lose hours "portal hopping" between separate OEM systems; consolidating location, runtime, and status onto a single platform returns that time. If a yard manager saves five hours a week on data aggregation, that's roughly 260 hours a year back for dispatching, customer follow-up, or safety work — a soft-dollar line worth naming in the model even if you discount it.
The Cost Side: Why the Pricing Model Changes the Math
ROI is savings over cost, and the cost denominator is where a lot of business cases quietly break. A multi-year telematics contract with annual escalators, early-termination penalties, and inactive-device fees inflates your real cost well past the headline rate — and for a rental fleet that fluctuates with utilization and season, you can end up paying for trackers that left the yard. Our guide to the hidden costs of a fleet tracking contract breaks down those clauses, and the full cost of a GPS tracker covers the pricing landscape.
WHAT IS TCO (TOTAL COST OF OWNERSHIP)?
TCO is the full cost of an asset across its life — acquisition, operation, maintenance, insurance, and disposal. In an ROI model it's the denominator: a lower, more predictable tracking cost improves the ratio on every project. Escalators and inactive-device fees quietly raise TCO; per-asset billing on one agreement with one end date keeps it honest.
Hapn keeps the denominator clean. Pricing is per asset and published — $10/mo for asset and vehicle tracking, $13/mo for equipment tracking with utilization, and $18/mo for equipment telematics with engine data — and you pay per tracked asset, not per yard, so a second branch doesn't multiply the bill the way per-site rental software does (see per-asset vs per-site pricing). There are two ways to buy: a 3-year agreement with all hardware, dash cams, and install kits included at no upfront cost, or a 1-year agreement with hardware purchased at cost. Neither carries escalators, inactive-device fees, or termination penalties — so the cost side of your ROI stays flat and predictable across the model's horizon.
Build Your Custom ROI Model
Every fleet is different — a dealer network weighs utilization and sub-rental spend, an equipment financier weighs recovery and installed-base visibility. Start with the template above and your own three-year history. For larger fleets, Hapn's team can help build a business case against your actual numbers rather than industry averages. The strongest ROI case is the one where every input is yours.
Written by the Hapn Team
Hapn provides per-asset GPS tracking for equipment rental businesses, multi-yard dealers, and equipment financiers — vehicles, powered equipment, and battery-powered assets on one platform, with transparent published pricing.
Frequently Asked Questions
How do I calculate ROI for GPS fleet tracking?
Sum your estimated annual savings from the levers you can measure — recovered billing, redeployed idle assets, theft recovery, and maintenance/admin efficiency — then divide by the annual cost of hardware and subscription. Use your own operation's numbers rather than industry averages, and build the case so it works on billing, utilization, and theft alone; treat any insurance credit as upside. Hapn's per-asset pricing keeps the cost side predictable, which improves the ratio.
Which savings lever pays back fastest for a rental fleet?
For most rental operators it's recovered billing. Telematics runtime and engine-hour data lets you bill actual usage instead of a nominal shift, and even a couple of unbilled hours per week across a fleet adds up quickly. Utilization gains from redeploying idle assets instead of sub-renting are usually the second-fastest line.
Do insurers really discount premiums for GPS tracking?
Some do, but it varies widely by carrier and policy, so it should not anchor your business case. Ask your broker specifically about telematics or recovery-device credits at renewal; if your carrier offers one, add it as upside. Build the ROI so it stands on billing, utilization, and theft recovery, and treat any insurance credit as a bonus rather than a dependency.
Does the pricing model affect fleet tracking ROI?
Yes — the cost denominator is half the ratio. Multi-year contracts with annual escalators, inactive-device fees, and termination penalties inflate real cost above the headline rate, especially for a fleet that shrinks and grows. Hapn prices per asset ($10/$13/$18 per month) with two models: a 3-year plan with hardware included, or a 1-year agreement with hardware purchased at cost. Assets you add later are prorated onto the same agreement, so the cost side stays predictable.
Does Hapn offer an ROI calculator or template?
Yes — there's a downloadable spreadsheet template with the formulas pre-built for utilization, theft, and maintenance savings, so you can drop in your own numbers. For larger fleets, Hapn's team can help build a business case against your actual historical data; ask through the pricing or quote page.
Build the case on real numbers
Per-asset pricing and all your assets on one platform. See what tracking would cost your fleet.
Get Hapn pricing →Last Updated: August 7, 2026
Explore Hapn on a live equipment fleet
Click around the real platform — a live mixed fleet with dummy data. No sales call, takes a few minutes.

Get the latest news straight to your inbox.
Share Article
