We’ve been collecting driving behavior data from our OBD trackers for a while now — harsh acceleration, harsh braking, harsh cornering, and speeding. The data was there, but there wasn’t a great way for you to actually see it and act on it. That changes today.
The Driving Behavior Report is now available in the Reports section of your Hapn dashboard. It pulls everything your OBD trackers are already capturing and puts it into a single, sortable, exportable report — the same way you already use Fleet Utilization, Daily Active Hours, and your other Hapn reports.
What’s in the Report
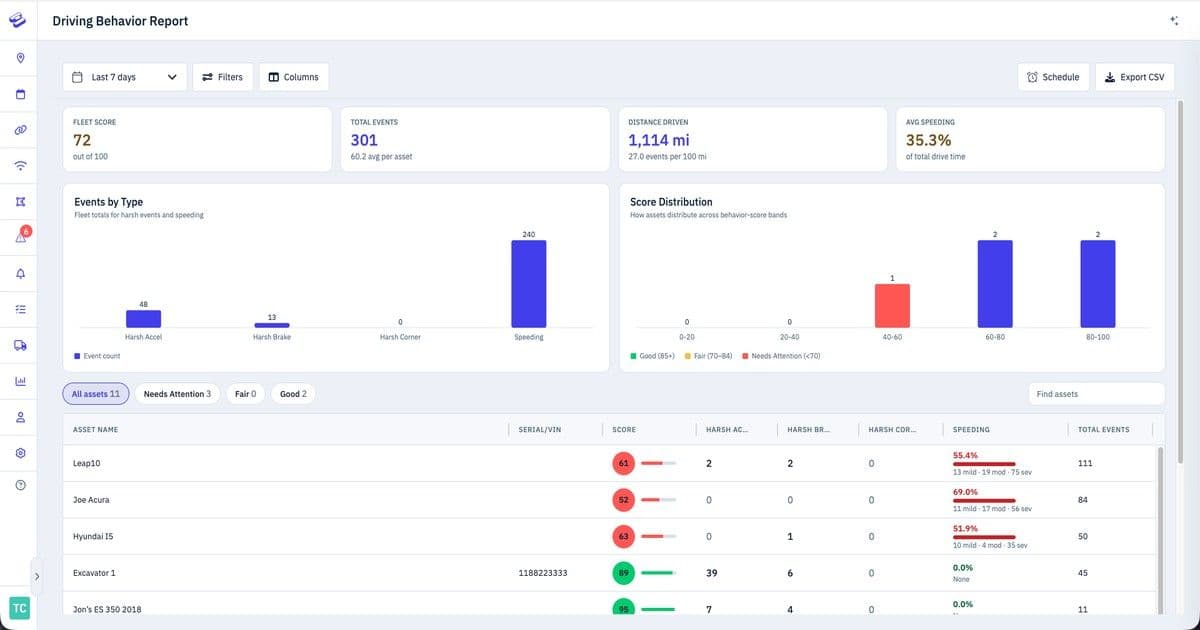
The Driving Behavior Report is organized around four fleet-wide metrics at the top, followed by an asset-level table with the details.
Fleet Score — A composite behavior score from 0 to 100, averaged across all your OBD assets. It accounts for how frequently harsh events and speeding occur relative to miles driven, so a high-mileage asset isn’t unfairly penalized. Higher is better.
Total Events — The total count of harsh driving events and speeding instances across your fleet for the selected time period, along with the rate per 100 miles driven.
Distance Driven — Total miles driven across all assets in the report, with per-asset averages.
Avg Speeding — The average percentage of drive time your fleet spent exceeding posted speed limits.
The Asset Table
Below the summary cards, every OBD-equipped asset gets its own row in the table. You can see each asset’s behavior score, individual counts for harsh acceleration, harsh braking, and harsh cornering, plus a speeding breakdown that shows the percentage of drive time over the limit — and how many of those instances were mild, moderate, or severe.
Each asset is categorized as Good (score 85 or above), Fair (70–84), or Needs Attention (below 70). You can filter the table by status using the chips at the top, or use the search bar to find a specific asset by name or serial number.
Speeding Severity
Not all speeding is the same, and the report reflects that. Every speeding instance is categorized into one of three severity bands:
- Mild — 1–10 mph over the posted speed limit
- Moderate — 11–20 mph over
- Severe — 20+ mph over
The speeding column in the table shows both the overall percentage and a count of events at each severity level, so you can quickly see whether your fleet’s speeding issues are minor or something that needs immediate attention.
Charts
Two charts sit between the summary cards and the asset table. Events by Type shows how your fleet’s harsh events break down across acceleration, braking, cornering, and speeding. Score Distribution shows how your assets are spread across behavior-score bands, with reference lines at the 70 and 85 thresholds so you can see at a glance how much of your fleet falls into each category.
Schedule It, Export It
The Driving Behavior Report works exactly like your other Hapn reports. Use the Schedule button to set up recurring email delivery — weekly is a popular choice for fleet behavior reviews. Use Export CSV to download the data and share it with safety leadership, insurance providers, or anyone else who needs it.
You can adjust the time period with the dropdown (Last 7 days, Last 14 days, Last 30 days, or Last 90 days), and use the Filters and Columns buttons to customize exactly what you see.
Who Is This For
If you have Hapn OBD trackers installed in your fleet, the Driving Behavior Report is already available in your account. It’s designed for fleet managers and operations leads who want to identify risky driving patterns, coach drivers with specific data, and track improvement over time. Instead of relying on gut feel or waiting for an incident, you now have a weekly (or daily) picture of how your fleet is actually being driven.
Get Started
Log into your Hapn dashboard and navigate to Reports → Driving Behavior Report. The data from your OBD trackers is already flowing in — no setup required. If you want it delivered to your inbox every Monday morning, hit Schedule and you’re set.
Explore Hapn on a live equipment fleet
Click around the real platform — a live mixed fleet with dummy data. No sales call, takes a few minutes.
Volume discounts • No 3-year contracts • Quote in ~24 hours


Get the latest news straight to your inbox.
Share Article
