It is the classic rental trap: your yard looks empty, your dispatch board is full, and your mechanics are swamped. You feel busy. But when you look at the P&L at the end of the month, the margins are thinner than they should be.
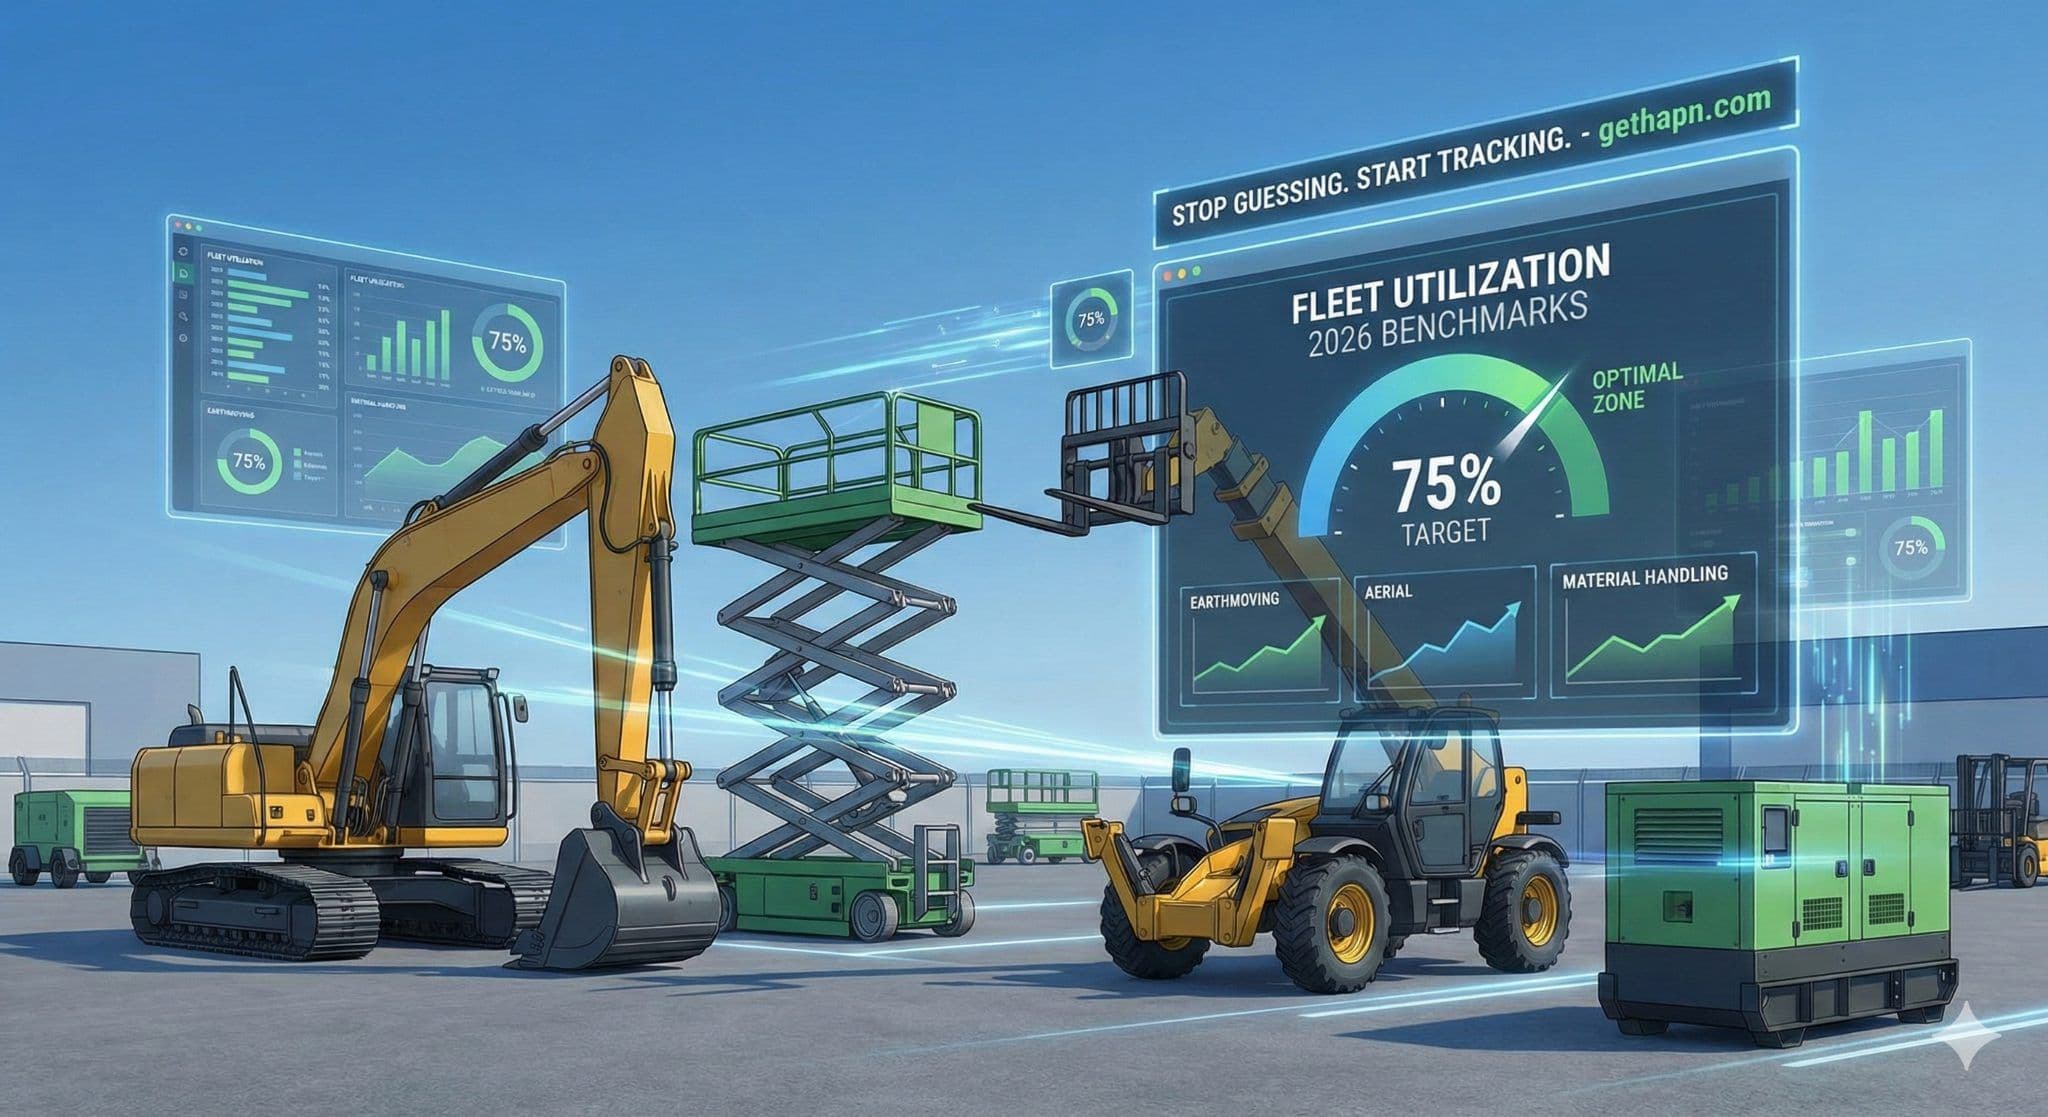
Being "busy" is not the same as being profitable. A healthy equipment rental fleet should target 65–75% time utilization across most asset classes — and if you're consistently above 85% or below 55%, you have a problem on opposite ends of the spectrum. In the competitive landscape of 2026, the difference between a rental company that survives and one that dominates comes down to a single metric: utilization.
Last updated: February 2026
Key Takeaways
- Healthy time utilization for most rental equipment classes falls between 65–75% — consistently below 55% means you're over-fleeted, above 85% means you're missing opportunities and deferring maintenance.
- Time utilization alone is misleading — you need to track financial utilization (revenue vs. acquisition cost) and engine-hour usage to see the full picture.
- Reactive repairs cost roughly 4× more than preventive maintenance — skipping service to inflate utilization destroys long-term margins.
- "Ghost assets" — equipment you own but can't rent because you don't know its status — are the most common hidden killer of utilization in fleets still using spreadsheets or whiteboards.
- Unifying OEM data via AEMP into a single platform eliminates portal-hopping and gives you one utilization report across your entire mixed fleet.
About Hapn
Hapn is a full-stack GPS fleet and asset tracking platform for midmarket and enterprise companies, providing equipment telematics, vehicle tracking, AI dash cameras, and battery-powered asset monitoring on a single dashboard — with transparent pricing and no long-term contracts.
But aiming for "100% utilization" is a rookie mistake. If you are constantly at 100%, you are turning away customers and likely failing on maintenance. Conversely, if you are hovering at 40%, you are bleeding capital expenses on assets that are just gathering rust.
To navigate this, you need data. In this guide, we will break down the 2026 equipment utilization benchmarks by asset class, explain the difference between "time utilization" and "dollar utilization," and show you how to use telematics to ensure every machine in your mixed fleet is pulling its weight.
The Three Types of Utilization You Must Track
Before we look at the benchmarks, we have to agree on the math. Most rental businesses track Time Utilization and stop there. To truly optimize your fleet, you need a three-dimensional view.
1. Time Utilization (Physical)
This is the most common metric. It answers: What percentage of available time is the equipment out on rent?
Formula: (Days Rented / Days Available) × 100
Why it matters: It tells you if you have too much or too little inventory.
2. Financial Utilization (Dollar)
This answers: How much revenue is this asset generating compared to its potential?
Formula: (Annual Revenue / Original Acquisition Cost) × 100
Why it matters: A machine might be rented 80% of the time (high time utilization) but at a rock-bottom rate (low financial utilization). This metric exposes bad pricing strategies. For guidance on setting competitive rates, see our guide on how much to charge for rental equipment.
3. "True" Usage (Engine Hours)
This answers: Is the customer actually using the machine they rented?
Formula: Actual Engine Hours / Rented Hours
Why it matters: If a customer rents a generator for a week but runs it 24/7, your maintenance costs skyrocket. If they rent a dozer for a month but use it for 2 hours, they might demand a refund or "off-rent" credit. Tracking actual engine hours — as we covered in our engine hour-based maintenance guide — is the only way to see what's really happening with your iron.
2026 Equipment Utilization Benchmarks by Class
We have analyzed data across the industry to provide realistic targets for 2026. These numbers assume a healthy economic environment and a well-managed fleet.
Note: These are targets for Time Utilization. Hitting these numbers generally ensures profitability without sacrificing fleet health.
Earthmoving Equipment
Target: 65% – 75%
Earthmoving assets (Excavators, Dozers, Backhoes) are your capital-intensive workhorses.
- The Reality: Because these machines require significant maintenance and transport time, sustaining over 75% is difficult. If you consistently drop below 60%, you are likely over-fleeted.
- The 2026 Trend: We are seeing tighter margins here. Successful companies are using Hapn's construction fleet tracking to reduce "turnaround time" (cleaning/servicing) to push this number toward 75%.
Aerial Work Platforms (MEWPs)
Target: 70% – 80%
Scissor lifts and boom lifts are the "bread and butter" of many rental houses.
- The Reality: These assets have lower maintenance needs than earthmoving gear, allowing for higher uptime. However, because they are often rented for long-term projects, they can sit idle on job sites for days.
- The 2026 Trend: Focus on Financial Utilization here. Since competition drives rental rates down, you need high volume (80%+) to make the math work. For more on this, see our scissor lifts vs boom lifts rental guide.
Material Handling
Target: 70% – 75%
Telehandlers and industrial forklifts.
- The Reality: These are often the first units on a job site and the last to leave.
- The 2026 Trend: Utilization is high, but "hoarding" is a problem. Contractors often keep telehandlers on rent "just in case." This is good for your rental revenue but bad for availability if other customers are waiting.
General Tools & Compact Equipment
Target: 60% – 70%
Skid steers, compact track loaders (CTLs), and towable generators.
- The Reality: These units undergo brutal wear and tear. You need more downtime for repairs, which naturally caps your utilization ceiling.
- The 2026 Trend: Theft is a major disruptor here. As we covered in our $1 billion equipment theft breakdown, losing a skid steer doesn't just cost the asset value — it destroys your utilization metrics while you fight with insurance. Learn more about keeping track of tools and equipment to prevent losses.
| Equipment Class | Poor Utilization (<) | Healthy Target | Over-utilized (>) |
|---|---|---|---|
| Earthmoving | 55% | 65% – 75% | 85% |
| Aerial (MEWP) | 60% | 70% – 80% | 90% |
| Telehandlers | 60% | 70% – 75% | 85% |
| General / Compact | 50% | 60% – 70% | 80% |
The Hidden Killers of Utilization
Why do so many fleets struggle to hit these benchmarks? Usually, it is not a lack of demand. It is a lack of visibility.
1. The "Ghost Asset" Phenomenon
What is a ghost asset?
A ghost asset is equipment that appears on your books but can't generate revenue — either because you don't know its location, it's waiting on parts with no ETA, or it's sitting in a status limbo between "returned" and "ready to rent." Ghost assets are the single most common cause of utilization gaps in rental fleets that still rely on manual tracking.
In a manual system (whiteboards or spreadsheets), a machine might sit in the "Ready Line" for three days before a sales rep realizes it's available. That is three days of 0% utilization that you can never get back.
2. Maintenance Bottlenecks
Every hour a machine sits in the shop is an hour it isn't making money. However, skipping maintenance to boost short-term utilization is a disaster. As we discussed in our Total Cost of Ownership (TCO) guide, reactive repairs cost 4× more than preventive maintenance. The goal isn't to skip maintenance, but to schedule it during downtime rather than interrupting a rental.
3. Customer Hoarding
Your customer rents a boom lift for a "3-day job" but keeps it for two weeks because they might need it again. Meanwhile, you are turning away other customers who need that specific boom. While you are collecting daily rent, this can hurt your long-term business. If you run out of inventory, your other customers will call your competitors. Effective wait time management strategies help you balance customer satisfaction with utilization optimization.
Stop Guessing Your Fleet's Performance
Don't let invisible inefficiencies drain your margins. See exactly which assets are making money and which are costing you — no contracts, transparent pricing.
Get a Custom Quote →How to Improve Your Numbers in 2026
If your equipment utilization benchmarks are lagging, you don't necessarily need to buy more ads or lower your prices. You need to tighten your operations using data.
1. Shorten the "Ready-to-Rent" Cycle
Measure the time gap between Off-Rent (when the customer calls it off) and Ready-to-Rent (when it's cleaned, inspected, and back on the line). If this process takes 48 hours, cut it to 24.
How Hapn Helps: Hapn's equipment management solution allows you to geofence your yard. You get an alert the moment a returned asset enters the yard, triggering the service team to inspect it immediately.
2. Use Data to Right-Size Your Fleet
Look at your utilization by category over the last 12 months.
- Scenario A: Your 19ft scissor lifts are at 90% utilization.
Action: Buy more immediately. You are leaving money on the table. - Scenario B: Your 60ft booms are at 35% utilization.
Action: Sell two of them. They are depreciating faster than they are earning.
This is the core of business performance optimization — making capital decisions based on hard data, not gut feelings.
3. Dynamic Pricing Based on Demand
Airlines and hotels change prices based on utilization. Why shouldn't you? If your excavators are hitting 85% utilization this month, you have the leverage to increase your daily and weekly rates. If skid steers are sitting at 40%, run a promotion to get them moving. We broke down the full playbook in our dynamic pricing strategies guide. You can only execute this strategy if you have real-time visibility into your fleet's status.
4. Catch "Side Jobs" and Overuse
Sometimes, low financial utilization is actually theft of service. A customer might rent a machine for a "single shift" (8 hours/day) but run it for 16 hours. If you bill a flat daily rate, you are losing money on engine wear. By tracking engine hours remotely, you can bill for overages. This immediately improves your financial utilization per asset without renting it out any additional days. Learn more about billing equipment overages using telematics.
The Role of AEMP and Mixed Fleets
Hitting these benchmarks is relatively easy if you have 100 machines from one brand. But you likely have a mixed fleet: Cat, Deere, JLG, Genie, and Bobcat. Trying to calculate utilization by logging into five different OEM portals is impossible.
This is why unifying your data via AEMP is critical. Hapn pulls all your OEM data into one platform, giving you a single utilization report for the entire business, regardless of manufacturer.
Conclusion: Data Wins
In 2026, the equipment rental market is tighter and faster than ever. The companies that win won't be the ones with the most equipment; they will be the ones that utilize their equipment the best.
Stop guessing where your assets are. Stop letting units sit in the "cleaning" status for days. Start tracking, start measuring, and start hitting those benchmarks.
Written by the Hapn Team
Hapn provides GPS fleet and asset tracking for 50,000+ customers across construction, equipment rental, and 50+ other industries. Our platform processes over 4 billion messages annually with 99.9% uptime.
FAQ: Fleet Utilization
What is a good utilization rate for rental equipment?
For most general rental fleets, a Time Utilization of 65% to 75% is the "sweet spot." Below 60% usually indicates you have too much inventory, while consistently exceeding 80% suggests you are missing rental opportunities and should acquire more assets.
How do you calculate equipment utilization?
The standard formula for Time Utilization is: (Days Rented / Total Days Available) × 100. However, you should also calculate Financial Utilization (Revenue / Acquisition Cost) to ensure the equipment is actually profitable, not just busy.
What is the difference between time utilization and dollar utilization?
Time utilization measures activity (is it rented?), while dollar (financial) utilization measures profitability (is it making enough money?). A machine can have high time utilization but low dollar utilization if your rental rates are too low or maintenance costs are too high.
How does GPS tracking improve equipment utilization?
GPS tracking and telematics reduce the "turnaround time" between rentals, identify unused ghost assets, and prove actual usage hours for accurate billing — all of which directly increase utilization metrics. Hapn's equipment rental tracking solution unifies this data across mixed fleets from any OEM into a single dashboard, so you can run one utilization report instead of logging into five different portals.
What is a ghost asset in equipment rental?
A ghost asset is a piece of equipment on your books that can't generate revenue because its location or status is unknown. In fleets that track inventory manually — via whiteboards or spreadsheets — it's common for machines to sit idle for days after being returned before anyone realizes they're available. Platforms like Hapn eliminate ghost assets by providing real-time location and status data for every unit in your fleet.
Optimize Your Fleet with Hapn
Ready to maximize your utilization? Get the real-time data you need to make smarter buying, selling, and pricing decisions. No contracts, transparent pricing.
Request Pricing →